 Our panels are from Evergreen
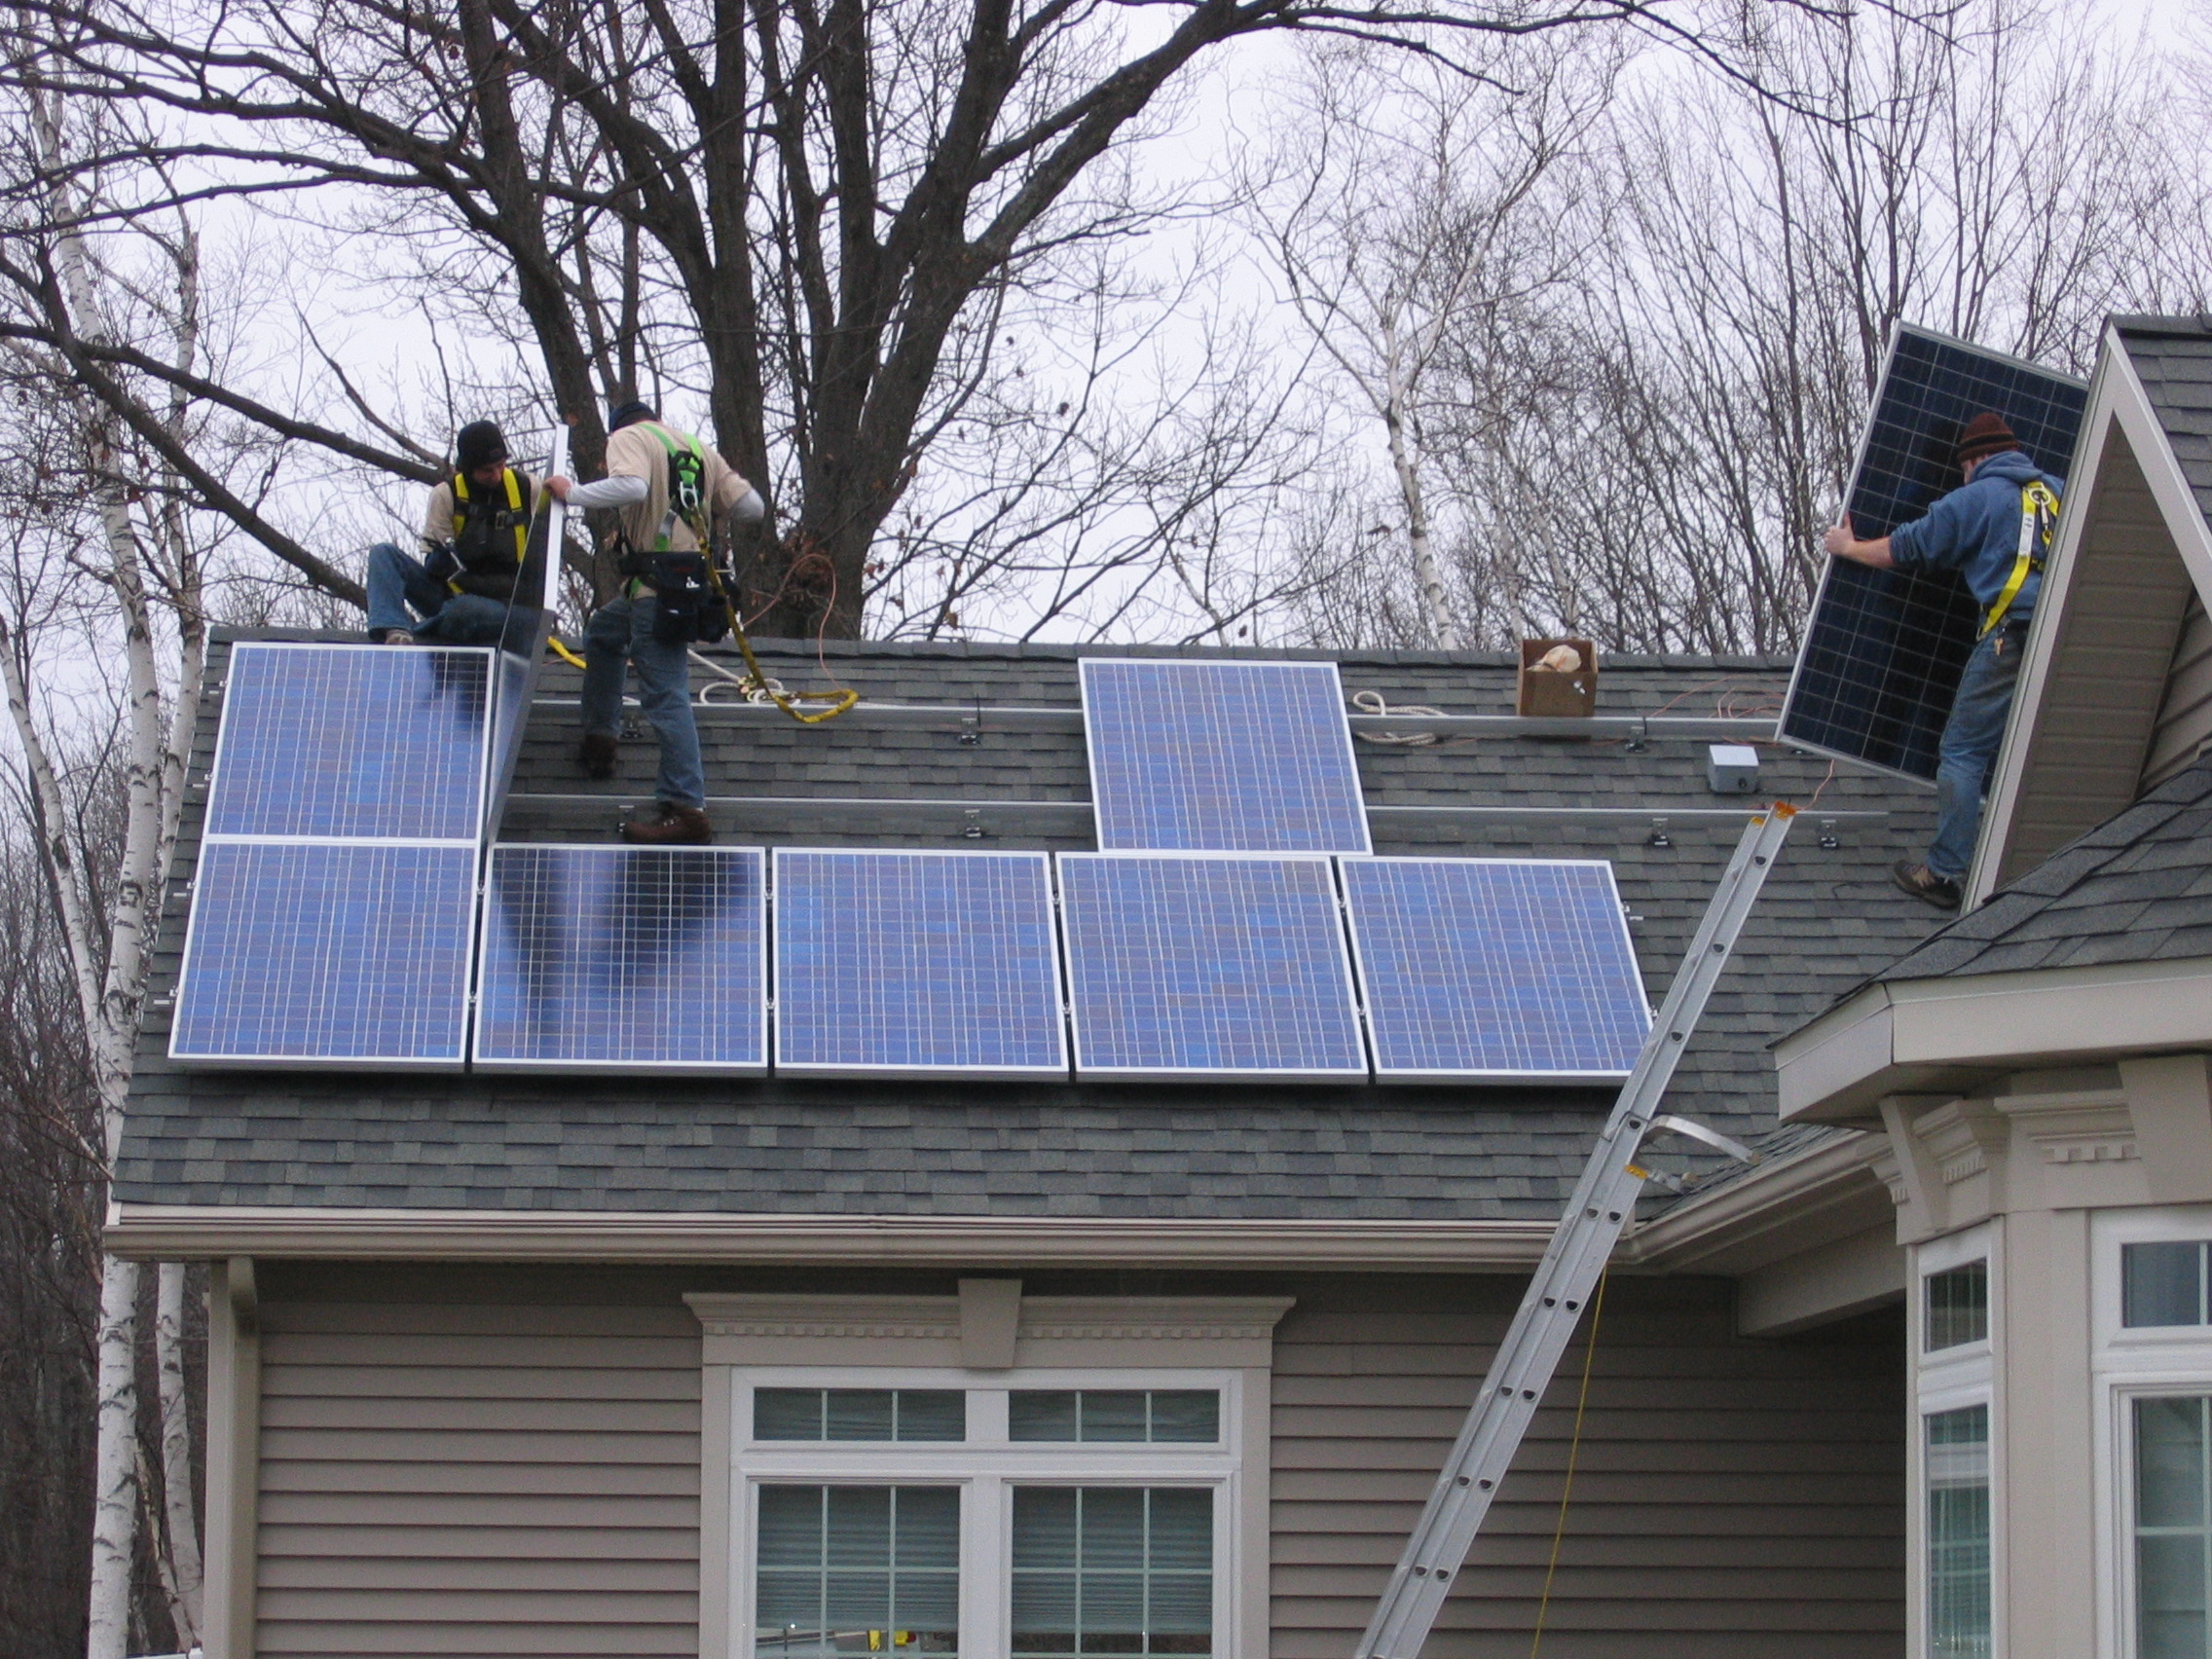
Solar and were installed by groSolar in January 2007. We have 27
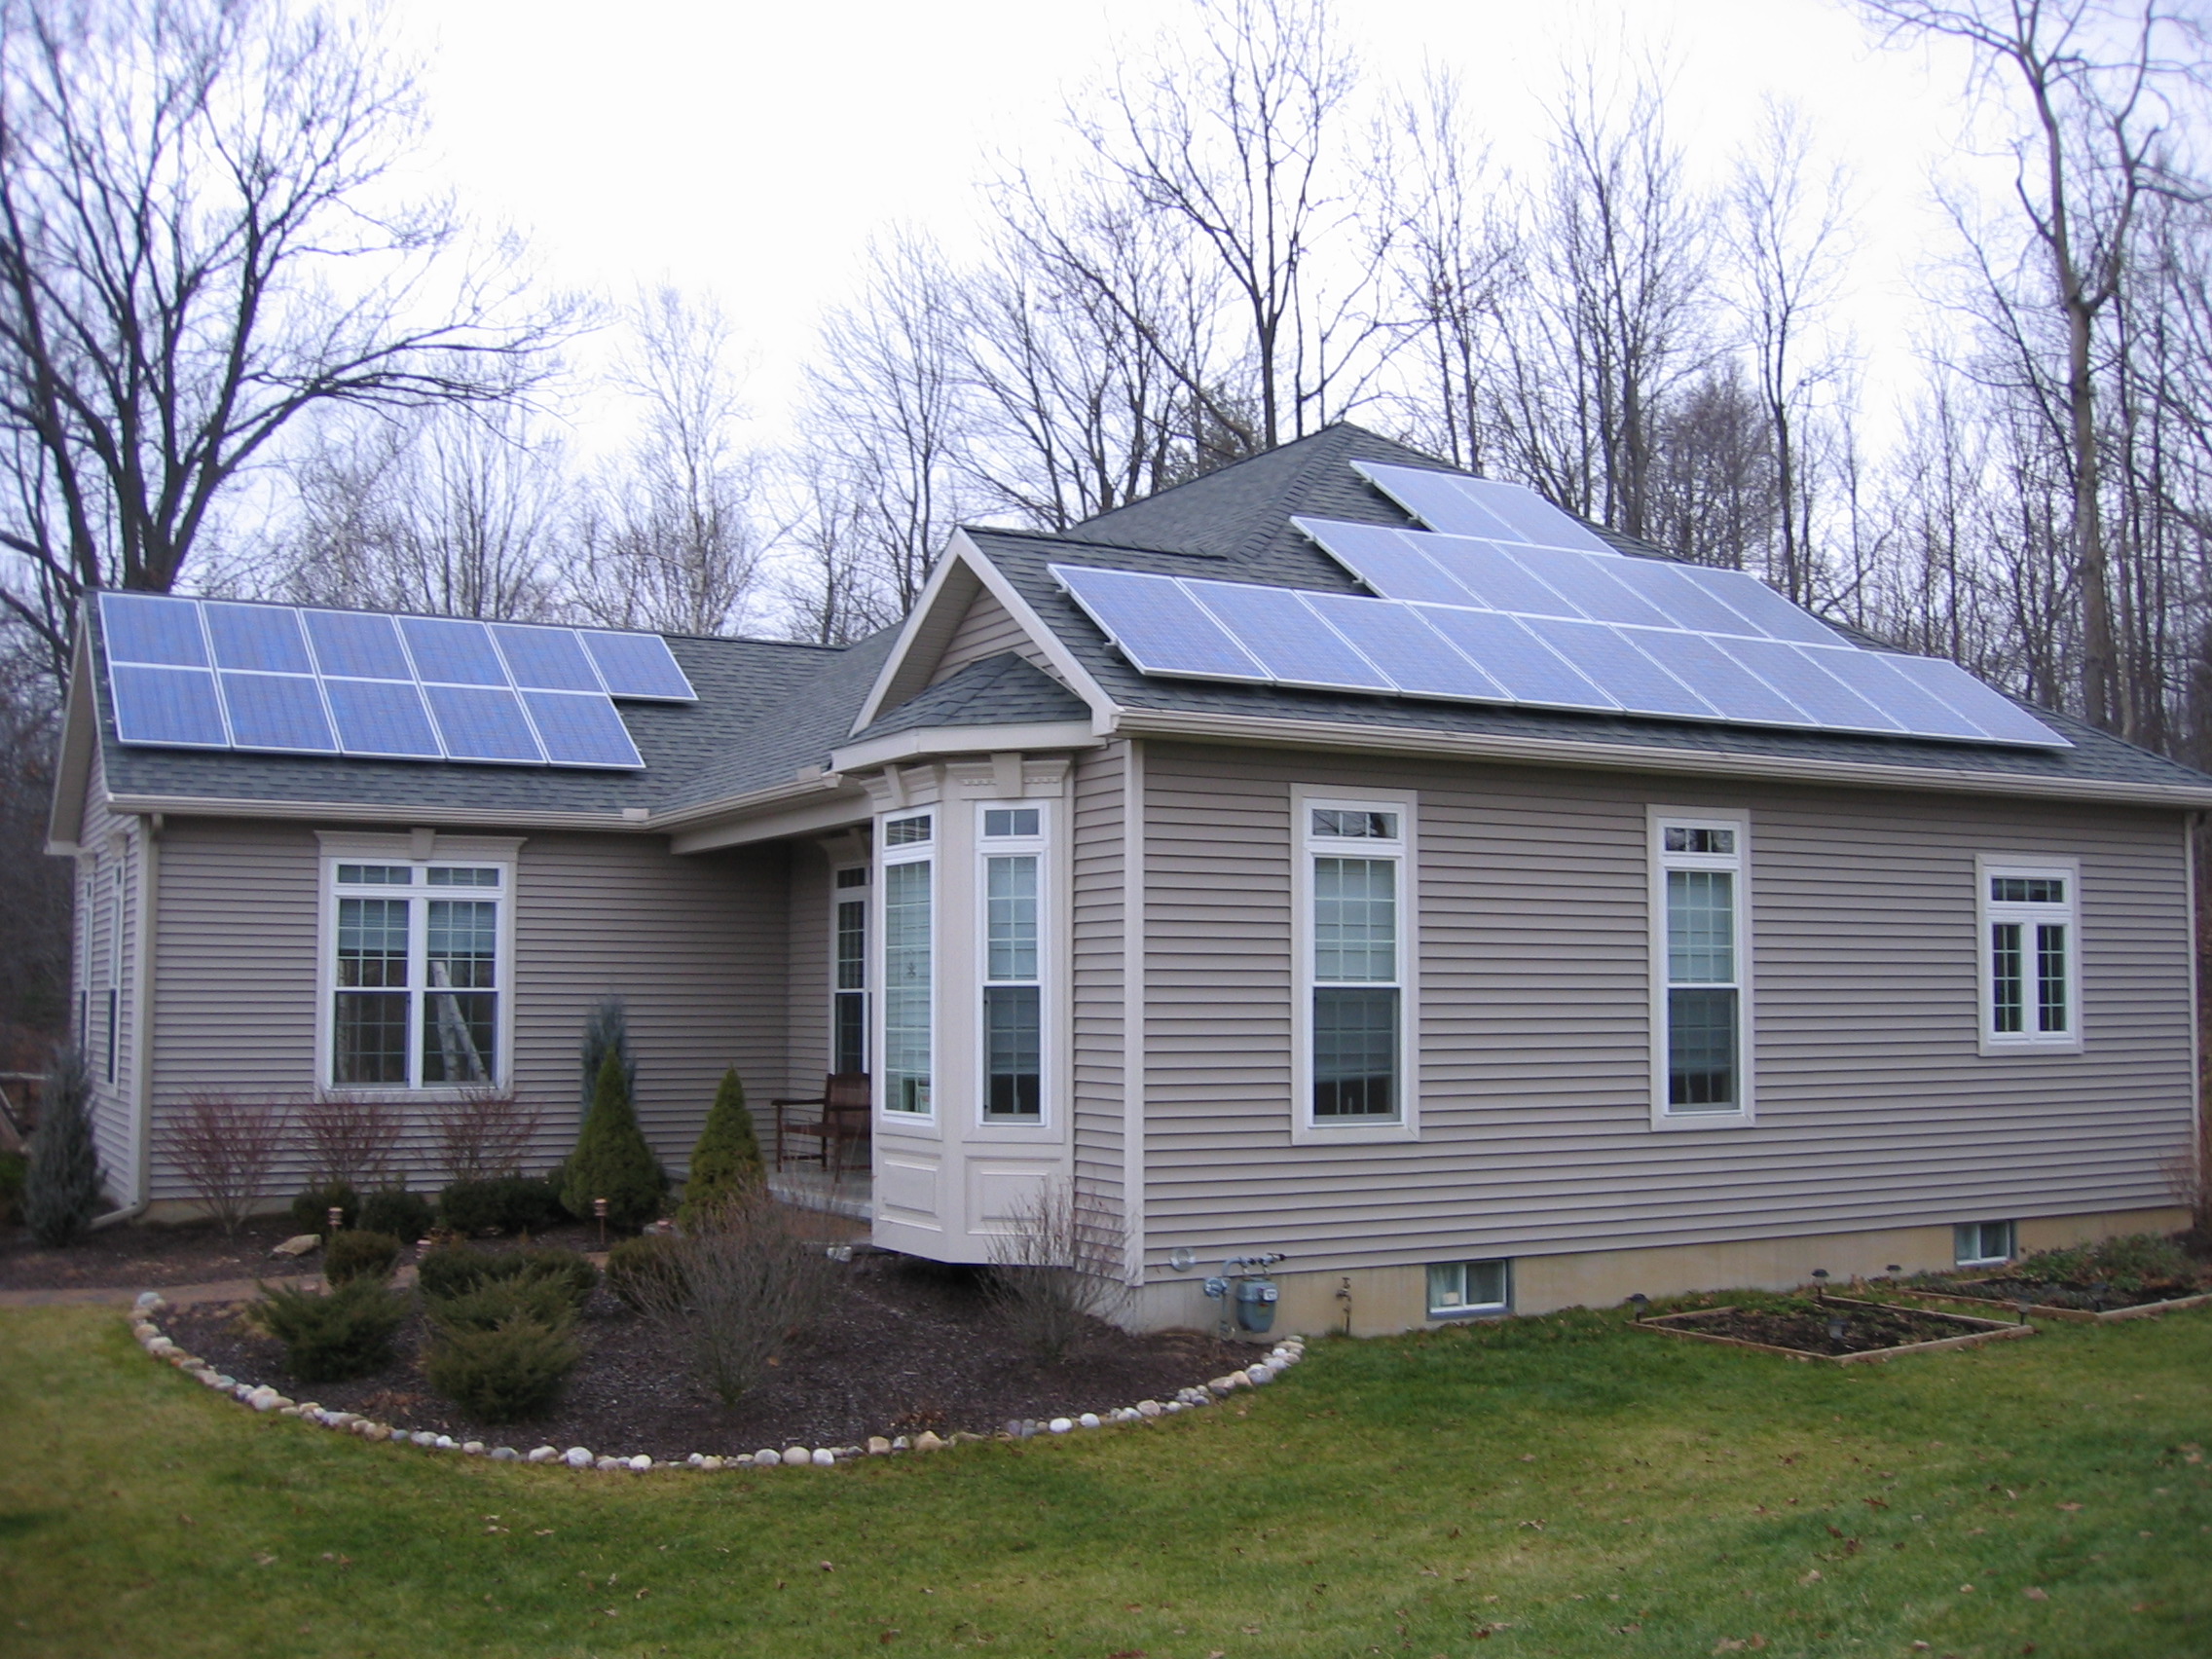
panels, each rated for 190W, for a total system of 5130W (5.13 kW).
Our roof has a 30° pitch and is oriented at 205° (almost due south).
Our panels are from Evergreen
Solar and were installed by groSolar in January 2007. We have 27
panels, each rated for 190W, for a total system of 5130W (5.13 kW).
Our roof has a 30° pitch and is oriented at 205° (almost due south).
| System Details |
Our panels are from Evergreen
Solar and were installed by groSolar in January 2007. We have 27
panels, each rated for 190W, for a total system of 5130W (5.13 kW).
Our roof has a 30° pitch and is oriented at 205° (almost due south).
To estimate the annual production of our system, we used the
Solar Insolation multipliers for different US cities.
Schenectady, NY (the closest city listed) has the lowest high, the 6th
lowest average, and the 19th lowest low, out of the 100 cities listed.
We receive on average an equivalent of 3.55 hours of peak sunlight per
day. Multiplied by our 5130W system, we should expect 551kWh per month.
However, we have a few trees blocking some of the panels in the early
morning and mid afternoon, particularly in the winter months.
Adjusted for these obstructions, our estimated average monthly output
is 506 kWh.
| Costs |
New York State has an excellent solar system incentive program. The typical rebate is $4.00 per watt; however, because our house is a New York ENERGY STAR Labeled Home, we received a $4.50 per watt rebate. Combining that with state and federal tax credits we ended up paying for only one third of the system cost.
| Costs | ||
| Photovoltaic panels: | $28,883 | |
| Inverters: | $ 6,132 | |
| Other materials: | $ 5,083 | |
| Shipping: | $ 1,630 | |
| Installation: | $ 4,076 | |
| Building permit: | $ 385 | |
| Electrical inspection: | $ 95 | |
| Expected maintenance: | $ 0 | |
| Total cost: | $46,284 | |
| Credits | ||
| NYSERDA incentive: | $23,085 | |
| State income tax credit: | $ 5,000 | |
| Federal income tax credit: | $ 2,000 | |
| Total credit: | $30,085 | |
| Net cost to us: | $16,199 | |
| Payback |
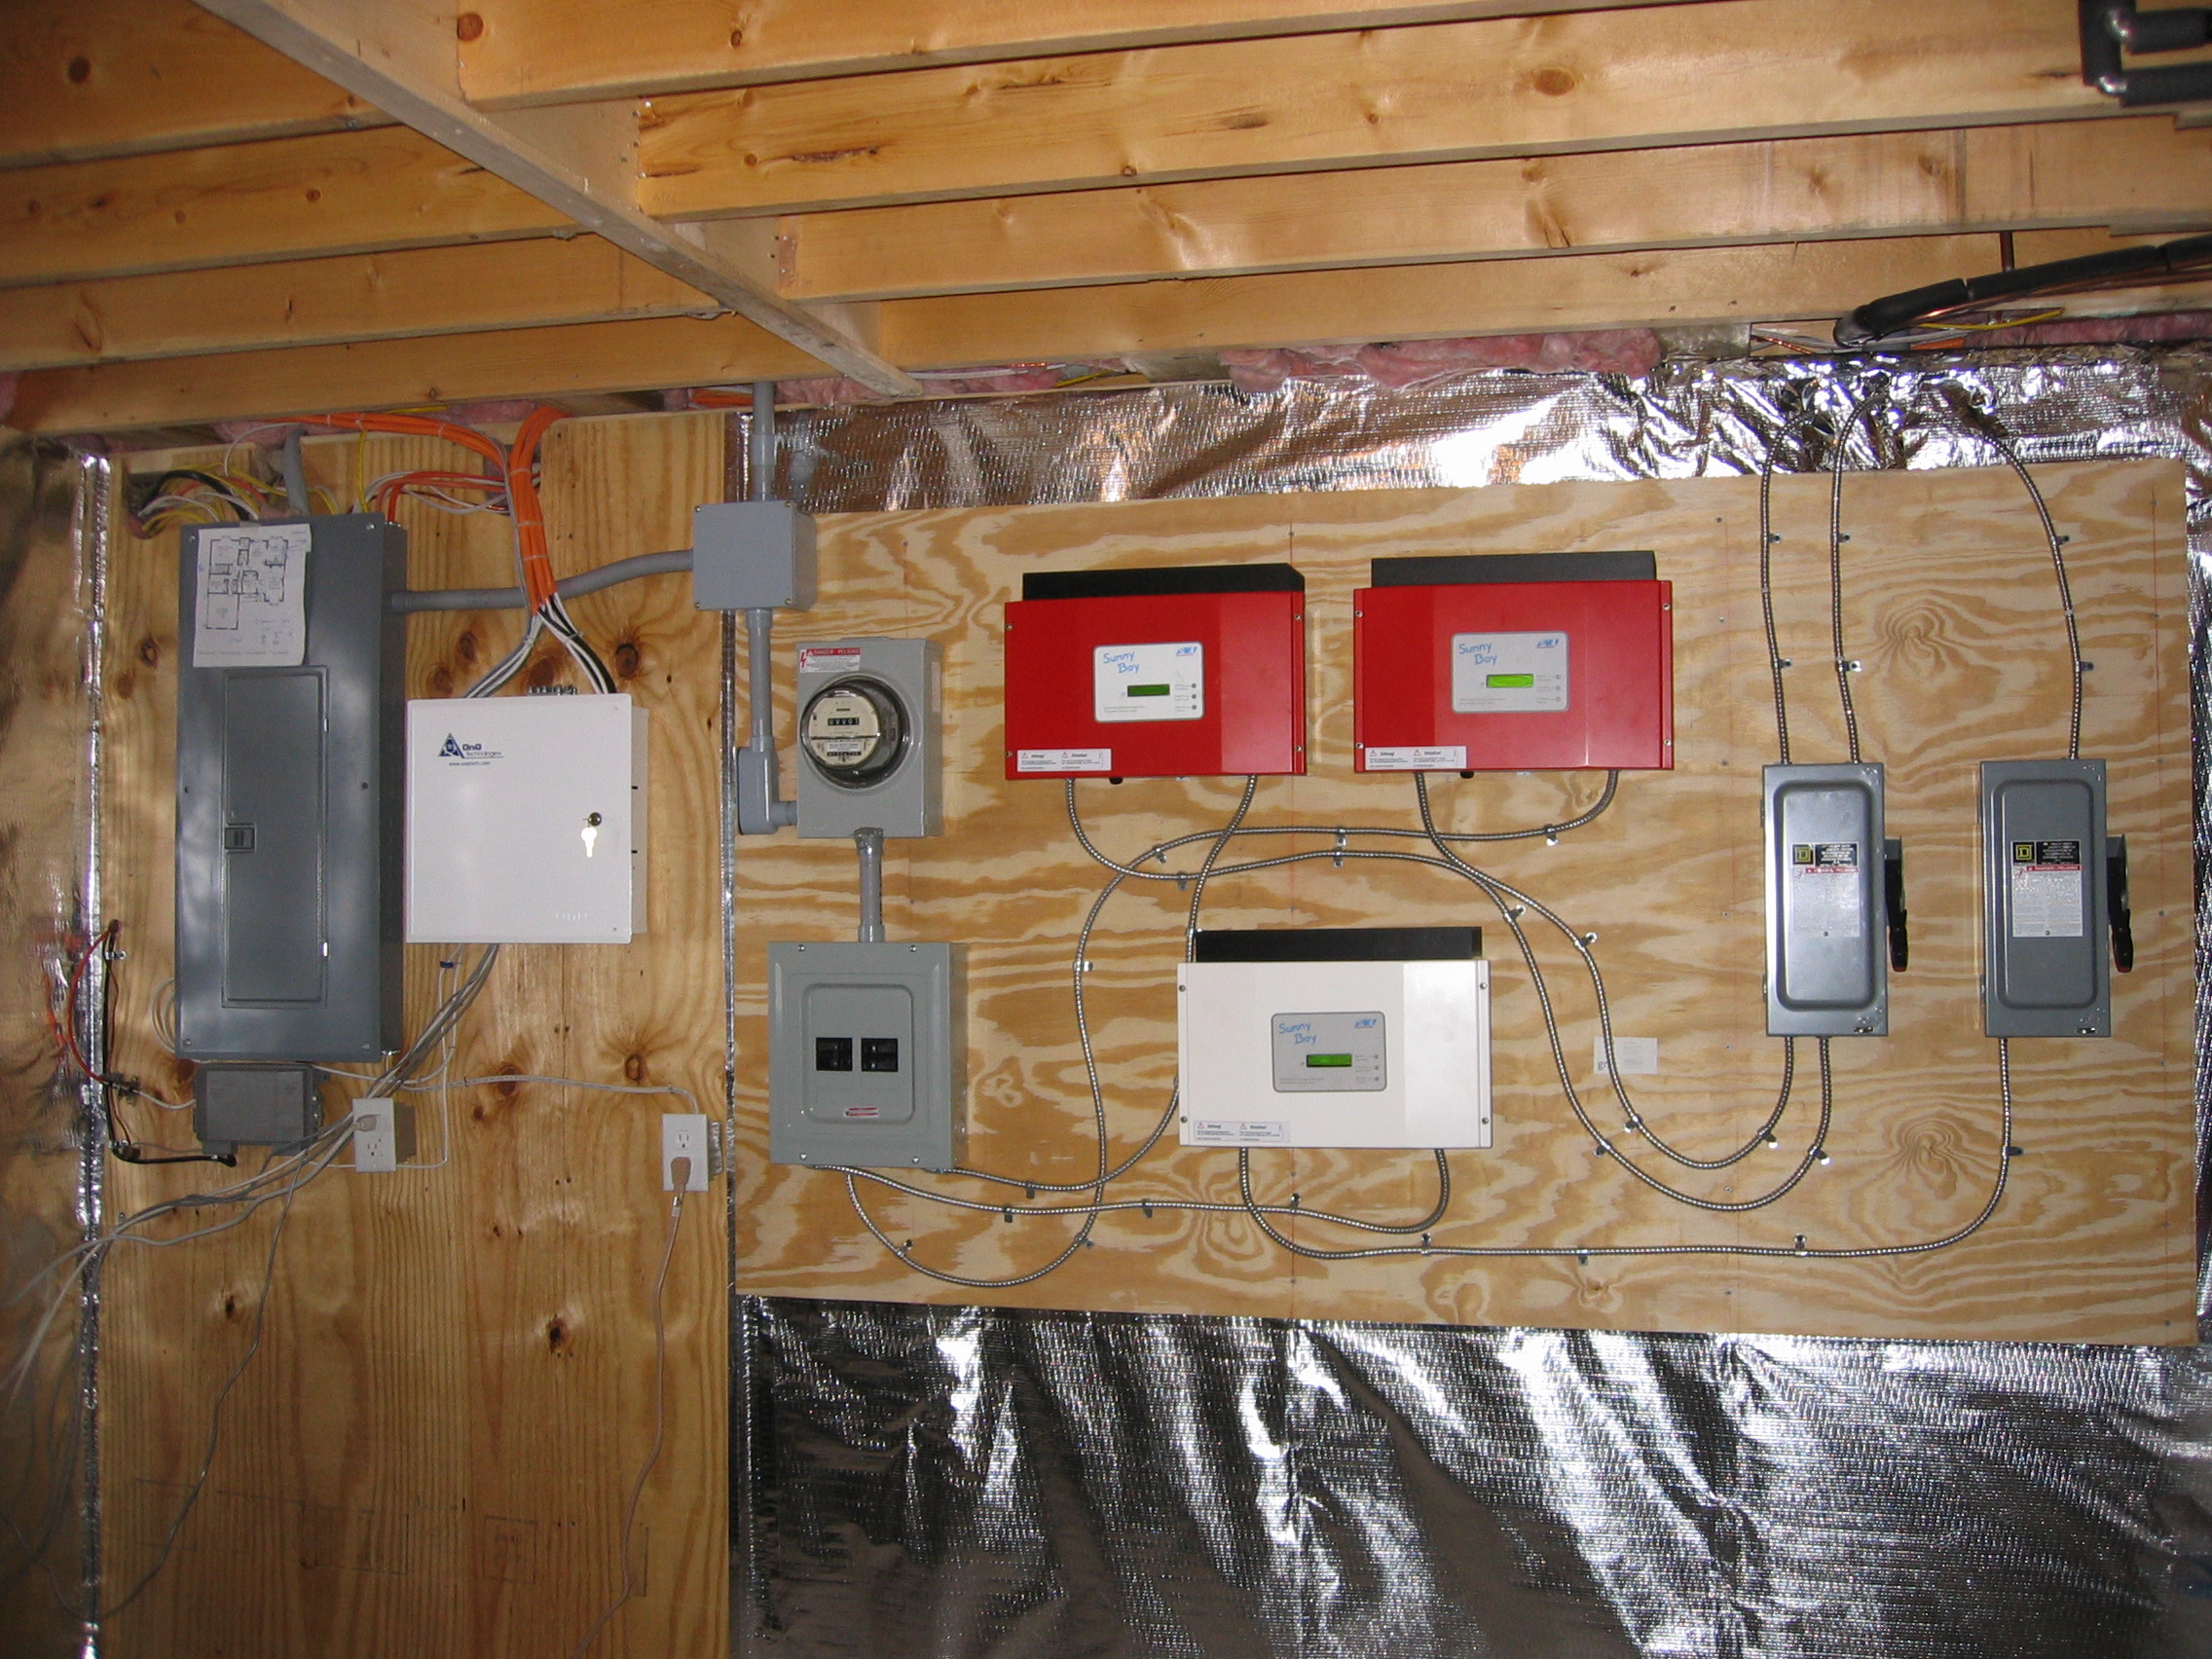 Our system is a "grid-tied system", which means that during the day
when we are generating more power than we are using our electric meter
spins backward. At night when the panels are off, our meter runs
forward. We do not have a battery backup system. If the grid goes
down, our panels are automatically disabled for the safety of the grid
repairmen.
Our system is a "grid-tied system", which means that during the day
when we are generating more power than we are using our electric meter
spins backward. At night when the panels are off, our meter runs
forward. We do not have a battery backup system. If the grid goes
down, our panels are automatically disabled for the safety of the grid
repairmen.
Prior to Jan 2007, our average monthly usage was approximately 790 kWh, and our average monthly electric bill was $125. We pay $0.17 per kWh (including delivery and taxes and an optional $0.015 per kWh renewable energy charge). We have natural gas heating, for which we pay an average of $98 per month. After reducing our electricity usage (described below) and installing the panels, our average monthly electric usage is 480 kWh and our average monthly electric bill is $23 (the base service charge is $16).
Our system generated 5640 kWh in the first year, which nearly covered all of our usage: we only had to buy 155 kWh. Including service and delivery costs our total electricity bill for the year was $178. The year before we installed the panels we used 9318 kWh and paid $1,573. Ignoring rising energy costs and lost interest we will recover the initial investment in 12.5 years.
In the second year, we generated 5665 kWh. We switched our anniversary month to March (the point in the year when the utility company zeroes out and pays for, at wholesale price, any accumulated credit). In March 2009 we received $40.12 for our 497 kWh credit.
| The Bills |
Our system was installed in January/February 2007 and after the final inspection on February 17th, 2007 we turned the system on.
| Our Usage |
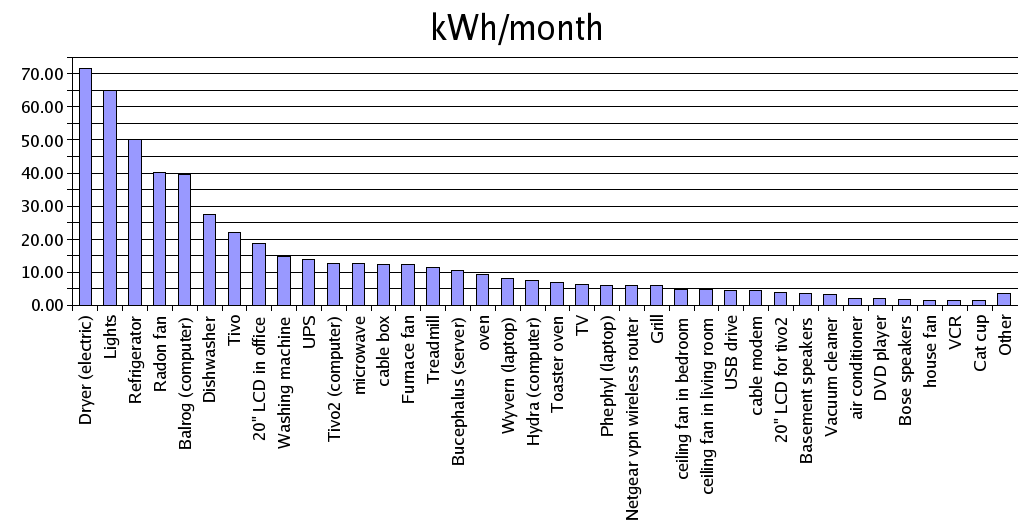
After receiving some of our highest bills in Summer/Fall 2006 we took a careful look at our usage. We were able to measure most of the electrical appliances in our house using the Kill-a-Watt. Switching to energy efficient lighting yielded our biggest savings. We also replaced a computer router that was one of the big culprits and set the computers to go into "hibernation" mode when not in use. Here is the estimated breakdown of our current monthly usage:
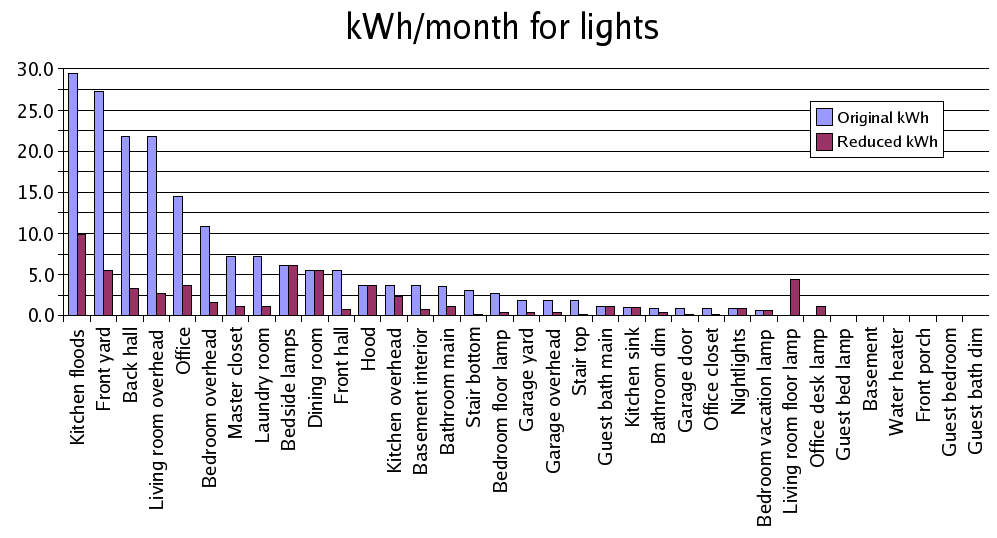
We already had a few compact flourescent bulbs, but in January 2007 we replaced nearly all of the remaining incandescent bulbs with compact fluorescents and altered our illumination habits. Our original lighting usage was approximately 200kWh per month, while now we are down to 65kWh:
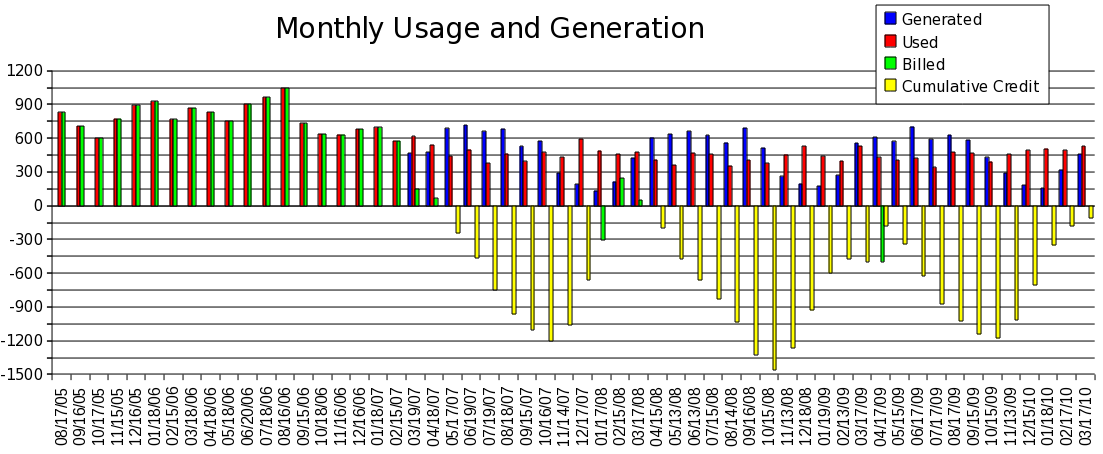
| Power Generated |
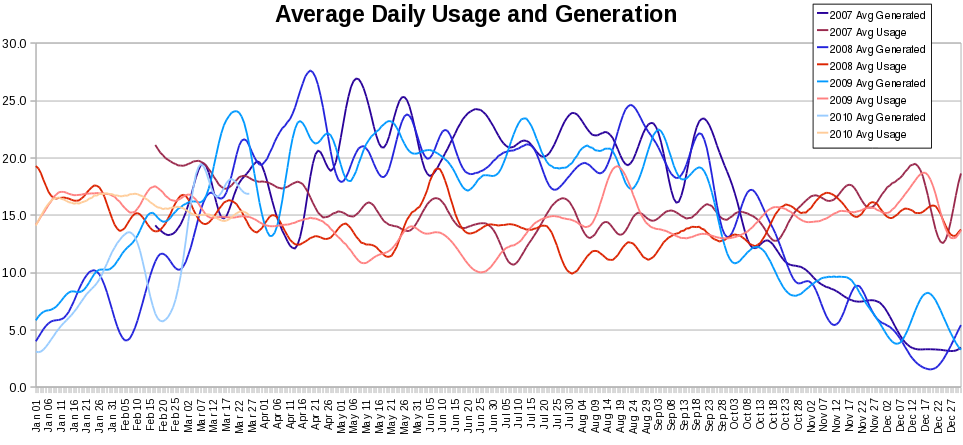
Here is a plot of the power generated by our system (blue) and our usage
(red) since the system was installed, averaged to smooth out the spikes.
Each night we read the meter in our basement (which measures the power
generated by our panels) and the outside meter (which measures the net
power). Net = Usage - Generated. The variation in the blue curve
corresponds to variations in weather.
This plot shows the actual daily variation in generation and use. The
spikes in the red curve correspond to laundry days (which is significant
because we have an electric dryer). We typically do 3-5 loads of laundry
every 1-2 weeks.

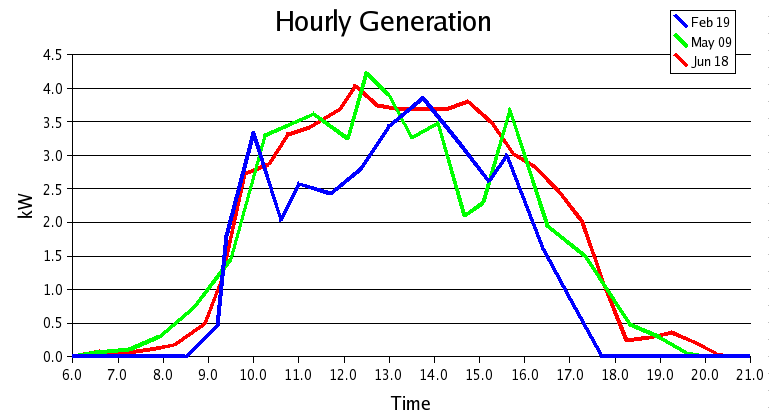
Here is a plot of the power generated by our system for three different days (note that some days are shifted by daylight savings time):
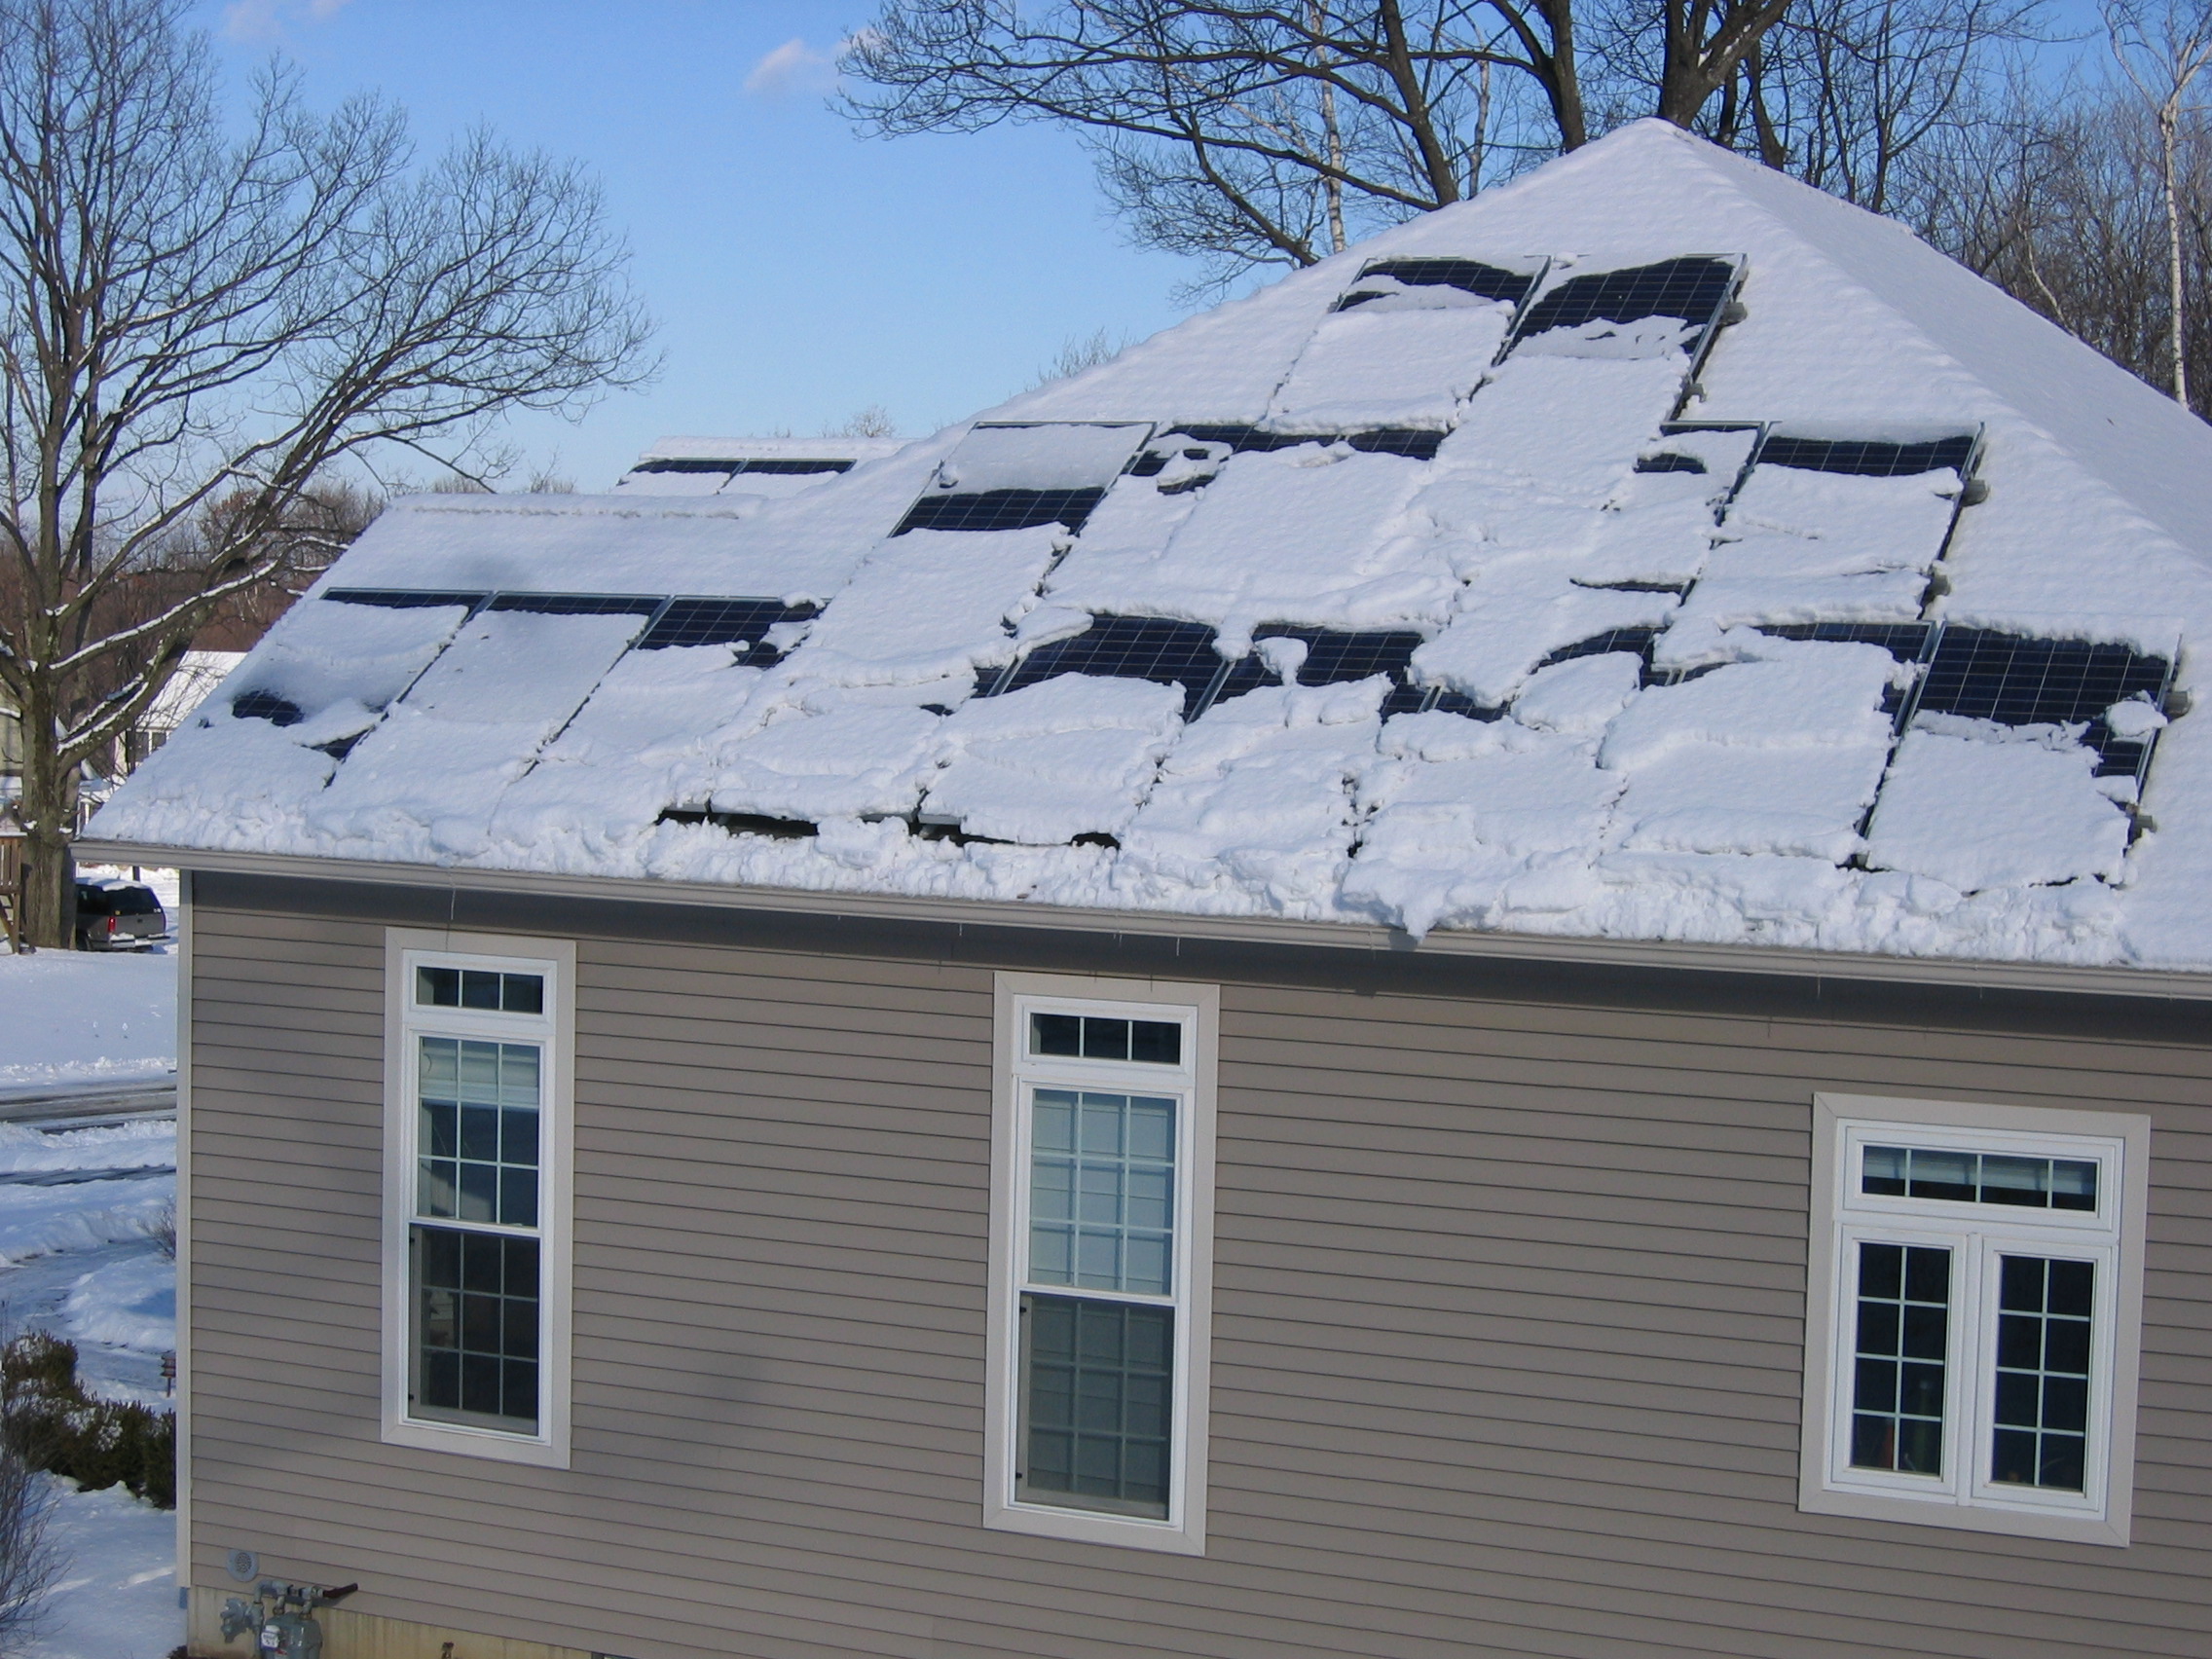
| Snow on the Panels |
 Even in the winter, the sun warms the panels, helping a light snow to melt
and slide off the panels. When we have a heavy snowfall, we use a "roof rake"
to gently pull the snow off of the roof.
Even in the winter, the sun warms the panels, helping a light snow to melt
and slide off the panels. When we have a heavy snowfall, we use a "roof rake"
to gently pull the snow off of the roof.
On May 9th, 2007, after a couple weeks of sunny, clear days our outside
meter that measures net power "rolled over" backward. This means that we
had used less power than we generated since our system was installed. In
Feburary 2008 we "rolled over" forward, and backward again in April 2008.
We have continued to reduce our usage and are now generating more than we
use, so our meter may permanently remain negative.
| More Information |
Contact us at: